Gain the R programming language fundamentals for doing the applied statistics useful for data exploration and analysis in data science and data mining. This book covers topics ranging from R syntax basics, descriptive statistics, and data visualizations to inferential statistics and regressions. After learning R’s syntax, you will work through data visualizations such as histograms and boxplot charting, descriptive statistics, and inferential statistics such as t-test, chi-square test, ANOVA, non-parametric test, and linear regressions. Learn R for Applied Statistics is a timely skills-migration book that equips you with the R programming fundamentals and introduces you to applied statistics for data explorations. What You Will LearnDiscover R, statistics, data science, data mining, and big dataMaster the fundamentals of R programming, including variables and arithmetic, vectors, lists, data frames, conditional statements, loops, and functionsWork with descriptive statistics Create data visualizations, including bar charts, line charts, scatter plots, boxplots, histograms, and scatterplotsUse inferential statistics including t-tests, chi-square tests, ANOVA, non-parametric tests, linear regressions, and multiple linear regressionsWho This Book Is ForThose who are interested in data science, in particular data exploration using applied statistics, and the use of R programming for data visualizations.
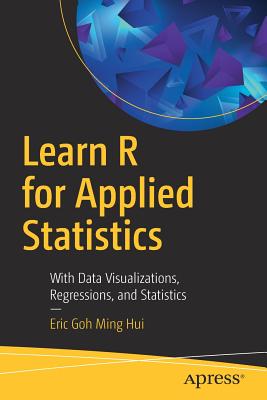
Gain the R programming language fundamentals for doing the applied statistics useful for data exploration and analysis in data science and data mining. This book covers topics ranging from R syntax basics, descriptive statistics, and data visualizations to inferential statistics and regressions. After learning R''s syntax, you will work through data visualizations such as histograms and boxplot charting, descriptive statistics, and inferential statistics such as t-test, chi-square test, ANOVA, non-parametric test, and linear regressions.
Learn R for Applied Statistics is a timely skills-migration book that equips you with the R programming fundamentals and introduces you to applied statistics for data explorations.
What You Will Learn
- Discover R, statistics, data science, data mining, and big data
- Master the fundamentals of R programming, including variables and arithmetic, vectors, lists, data frames, conditional statements, loops, and functions
- Work with descriptive statistics
- Create data visualizations, including bar charts, line charts, scatter plots, boxplots, histograms, and scatterplots
- Use inferential statistics including t-tests, chi-square tests, ANOVA, non-parametric tests, linear regressions, and multiple linear regressions
Who This Book Is For
Those who are interested in data science, in particular data exploration using applied statistics, and the use of R programming for data visualizations.
Get Learn R for Applied Statistics by at the best price and quality guranteed only at Werezi Africa largest book ecommerce store. The book was published by APress and it has pages. Enjoy Shopping Best Offers & Deals on books Online from Werezi - Receive at your doorstep - Fast Delivery - Secure mode of Payment
 Jacket, Women
 Woolend Jacket
 Western denim
 Mini Dresss
 Jacket, Women
 Woolend Jacket
 Western denim
 Mini Dresss
 Jacket, Women
 Woolend Jacket
 Western denim
 Mini Dresss
 Jacket, Women
 Woolend Jacket
 Western denim
 Mini Dresss
 Jacket, Women
 Woolend Jacket
 Western denim
 Mini Dresss
