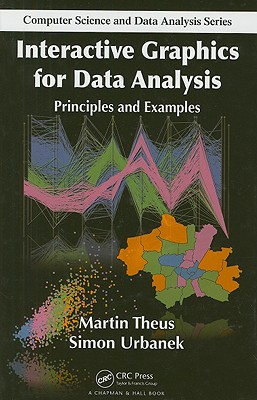
This full-color text discusses EDA and how interactive graphical methods can help gain insights as well as generate new questions and hypotheses from datasets. It presents the fundamental principles of graphical data analysis and includes detailed case studies that explain how the principles can be applied to the analysis of real-world datasets.
Interactive Graphics for Data Analysis: Principles and Examples discusses exploratory data analysis (EDA) and how interactive graphical methods can help gain insights as well as generate new questions and hypotheses from datasets.
Fundamentals of Interactive Statistical Graphics
The first part of the book summarizes principles and methodology, demonstrating how the different graphical representations of variables of a dataset are effectively used in an interactive setting. The authors introduce the most important plots and their interactive controls. They also examine various types of data, relations between variables, and plot ensembles.
Case Studies Illustrate the Principles
The second section focuses on nine case studies. Each case study describes the background, lists the main goals of the analysis and the variables in the dataset, shows what further numerical procedures can add to the graphical analysis, and summarizes important findings. Wherever applicable, the authors also provide the numerical analysis for datasets found in Cox and Snells landmark book.
Understand How to Analyze Data through Graphical Means
This full-color text shows that interactive graphical methods complement the traditional statistical toolbox to achieve more complete, easier to understand, and easier to interpret analyses.
Get Interactive Graphics for Data Analysis by at the best price and quality guranteed only at Werezi Africa largest book ecommerce store. The book was published by Taylor & Francis Inc and it has pages. Enjoy Shopping Best Offers & Deals on books Online from Werezi - Receive at your doorstep - Fast Delivery - Secure mode of Payment
 Jacket, Women
 Woolend Jacket
 Western denim
 Mini Dresss
 Jacket, Women
 Woolend Jacket
 Western denim
 Mini Dresss
 Jacket, Women
 Woolend Jacket
 Western denim
 Mini Dresss
 Jacket, Women
 Woolend Jacket
 Western denim
 Mini Dresss
 Jacket, Women
 Woolend Jacket
 Western denim
 Mini Dresss


