Search

Categories

    • categories-img Jacket, Women
    • categories-img Woolend Jacket
    • categories-img Western denim
    • categories-img Mini Dresss
    • categories-img Jacket, Women
    • categories-img Woolend Jacket
    • categories-img Western denim
    • categories-img Mini Dresss
    • categories-img Jacket, Women
    • categories-img Woolend Jacket
    • categories-img Western denim
    • categories-img Mini Dresss
    • categories-img Jacket, Women
    • categories-img Woolend Jacket
    • categories-img Western denim
    • categories-img Mini Dresss
    • categories-img Jacket, Women
    • categories-img Woolend Jacket
    • categories-img Western denim
    • categories-img Mini Dresss

Filter By Price

$
-
$

Dietary Needs

Top Rated Product

product-img product-img

Modern Chair

$165.00
product-img product-img

Plastic Chair

$165.00
product-img product-img

Design Rooms

$165.00

Brands

  • Wooden
  • Chair
  • Modern
  • Fabric
  • Shoulder
  • Winter
  • Accessories
  • Dress

Welcome and thank you for visiting us. For any query call us on 0799 626 359 or Email [email protected]

Offcanvas Menu Open

Shopping Cart

Africa largest book store

Sub Total:

Search for any Title

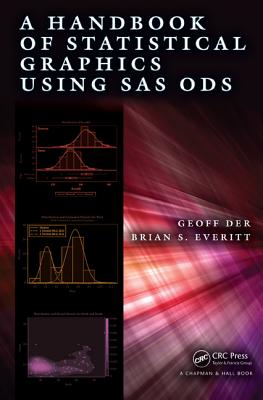
A Handbook of Statistical Graphics Using SAS ODS

By: (Author) Brian Everitt , (Author) Geoff Der

Manufacture on Demand

Ksh 12,250.00

Format: Hardback or Cased Book

ISBN-10: 1466599030

ISBN-13: 9781466599031

Publisher: Taylor & Francis Inc

Imprint: CRC Press Inc

Country of Manufacture: GB

Country of Publication: GB

Publication Date: Aug 15th, 2014

Print length: 244 Pages

Weight: 500 grams

Dimensions (height x width x thickness): 15.60 x 24.40 x 1.70 cms

Choose your Location

Shipping & Delivery

Door Delivery

Delivery fee

Delivery in 10 to 14 days

  • Description

  • Reviews

This handbook covers essential graphical methods for statisticians and explains how to implement the methods using SAS 9.4. It shows how to use SAS’s newer ODS graphics to create many types of statistical graphics for exploring data and diagnosing fitted models. Each chapter deals graphically with several sets of example data from a wide variety of areas, such as epidemiology, medicine, and psychology. The SAS programs and data sets are available online.

Easily Use SAS to Produce Your Graphics


Diagrams, plots, and other types of graphics are indispensable components in nearly all phases of statistical analysis, from the initial assessment of the data to the selection of appropriate statistical models to the diagnosis of the chosen models once they have been fitted to the data. Harnessing the full graphics capabilities of SAS, A Handbook of Statistical Graphics Using SAS ODS covers essential graphical methods needed in every statistician’s toolkit. It explains how to implement the methods using SAS 9.4.


The handbook shows how to use SAS to create many types of statistical graphics for exploring data and diagnosing fitted models. It uses SAS’s newer ODS graphics throughout as this system offers a number of advantages, including ease of use, high quality of results, consistent appearance, and convenient semiautomatic graphs from the statistical procedures.


Each chapter deals graphically with several sets of example data from a wide variety of areas, such as epidemiology, medicine, and psychology. These examples illustrate the use of graphic displays to give an overview of data, to suggest possible hypotheses for testing new data, and to interpret fitted statistical models. The SAS programs and data sets are available online.


Get A Handbook of Statistical Graphics Using SAS ODS by at the best price and quality guranteed only at Werezi Africa largest book ecommerce store. The book was published by Taylor & Francis Inc and it has pages. Enjoy Shopping Best Offers & Deals on books Online from Werezi - Receive at your doorstep - Fast Delivery - Secure mode of Payment

Customer Reviews

Based on 0 reviews

Mind, Body, & Spirit